Like in previous eras, current politicized discussions of crime ignore or distort crime data to intensify public fear, heighten racial tension, and undermine criminal justice reforms that promote long-term, sustainable public safety. The best way to protect against such attempts that highjack public discussions of crime and public safety is to be informed about how discussions of crime statistics can be manipulated for political gain.
In the latest report by the Thurgood Marshall Institute, we examine three false narratives presented by politicians and the media to explain the 2020 nationwide increase in homicides: the expansion of bail reform, practices of progressive prosecutors, and attempts to defund the police. Our analysis reveals that the empirical data contradicts these narratives. Our data suggests that pandemic induced instability and inequality are the primary drivers of recent increases in homicides.
The COVID-19 pandemic drove the 2020 homicide spike, but local factors influenced whether and how quickly a city bounced back in 2021.
“Tough-on-crime” practices (e.g., law-and-order prosecutors, absence of bail reform, and increased police budgets) did not prevent cities from experiencing a homicide spike in 2020.
Social and economic instability and heightened inequalities generated by the COVID-19 pandemic best explain the recent increases in homicides.
Pandemic-induced economic instability is associated with increases in homicides.
Pre-pandemic economic inequality is associated with increases in homicides.
Pre-pandemic evictions are associated with increases in homicides.
Unsubstantiated crime narratives prevent us from understanding the factors contributing to recent increases in violent crime and undermine our investments in evidence-based solutions. Misdiagnosing the causes of crime compromises public safety, similar to when a doctor misdiagnoses you with the wrong ailment and subsequently prescribes medication that fails to address your underlying issues while exacerbating your condition.
Politicians have lobbed disparaging attacks against criminal justice reforms despite contradictory evidence. Public officials, regardless of party affiliation, create fear-mongering narratives about why crimes are happening to convince the public that their strategy is correct. Whether it is Senator Lindsey Graham (R-SC) incorrectly arguing that crime would increase without aggressive prosecutors and increased police funding, or New York City’s Democratic Mayor, Eric Adams, blaming the city’s bail reforms for increases in crime, public actors disparage criminal justice reforms based on false and inaccurate premises. These political actors engage in this rhetoric despite research studies proving their assertions are flatly wrong. This rhetoric leads to harmful and counterproductive policies that aim to increase policing and incarceration, which particularly harm Black people. Unfortunately, the pattern of peddling harmful “tough-on-crime” narratives is not new, but a cyclical component of U.S. history.
Promoting public safety is serious business that requires precise, thoughtful analysis, not distortions designed to evoke fear and anger. Crime is a complex and varied phenomenon, and solutions to address crime must be grounded in data, equity, and fairness. The need for accurate assessments is critical, lest false narratives and distorted data contribute to the harming of communities by law enforcement, just as they did in the War on Drugs. Here, we examine three false narratives presented by politicians and the media to explain the recent increase in homicides nationwide: the expansion of bail reform, practices of progressive prosecutors, and calls to defund the police. Our analysis reveals that the empirical data contradicts these narratives. Our data substantiates other reasons for a spike in homicide rates: pandemic-induced instability and econmic inequality.
There are substantial differences between federal government crime statistics (the Uniform Crime Report [UCR] and National Crime Victimization Survey [NCVS]) and local police agencies. Although the UCR is the most accessible and comprehensive national measure of crime, homicide numbers in the UCR may be different than local police department reports.
Our research found a 200-victim discrepancy in homicides between what the UCR preliminarily reported for Philadelphia versus the Philadelphia Police Department. Furthermore, recent reporting from The Marshall Project has shown that the 2021 federal crime data suffers from credibility issues. At times, this discrepancy between federal and local counts is because the Federal Bureau of Investigation (FBI), the agency responsible for publishing the UCR, removes counts of justifiable murder and negligent manslaughter from its homicide counts.
Another potential reason for this discrepancy could be systemic misreporting. Several departments, like New York City, Chicago, Philadelphia, New Orleans, and Milwaukee, have a history of misreporting their numbers. Further complicating crime statistics is that most violent crimes and property crimes are not reported to the police: only 40.9% of violent crimes were reported to the police, and only 32.5% of household property crimes were reported to the police in 2019 (these figures are estimated by comparing the NCVS data with the UCR data, which shows a huge gap between crime experienced by individuals and crimes reported to the police). This is not to say that crime statistics cannot be trusted, but that they should be evaluated critically. Police reports and the UCR will provide underestimates of certain types of crime not likely to be reported to the police or for which different definitions of crime complicates calculations.
Being critical of sources of information, whether data or press releases or otherwise, is essential. George Floyd’s murder underscores this fact: the Minneapolis Police Department’s press release simply contained the headline “Man Dies After Medical Incident During Police Interaction” while saying that Mr. Floyd “physically resisted officers” and that he “appeared to be suffering medical distress” after being handcuffed. We know now that this description did not accurately portray the brutality that unfolded at the scene, but initial police statements are often uncritically parroted in journalism and public discourse. Asking critical questions about information sources limits intentional and unintentional manipulation and elevates public discussions about the true causes of, and solutions to, crime. Consulting multiple sources on the same event, and understanding the limitations of each, can help provide a fuller picture of what occurred.
There are several ways to describe and interpret statistics, which either make the dynamics contributing to crime more clear or distorted. Since crime is local, discussing national crime trends may not tell us much about what is happening in our community. However, national trends can help us understand whether the crime pattern we observe in a specific area is an anomaly or part of a larger pattern. For these reasons, it is often better to discuss local crime data within a regional or national context. Comparisons between different cities and regions must also be standardized. If the number of homicides increases by three in both a large city (say, from 100-103) and a small town (from one to four), the percentage increase in homicides is much larger in the small town where homicides have quadrupled than in the big city, where the incidence of homicide has increased by only 3%. When viewing crime statistics, readers should understand how small numbers can affect percentages in a limited sample size: Remember to interpret percentages in a meaningful context! How much does the observation differ from typical variation?
Part of the reason why it is easy to “misdiagnose the ailment” in discussions of crime is that crime data is so dynamic and complex. There are many types of crime, and they do not all necessarily change within similar time periods or in similar directions. This variability suggests that the same factors may not explain different types of crime. For example, violent crimes are more likely to occur during the summer months, while property crimes are more frequent in colder months. Even when looking at a specific type of crime, such as homicide, there is substantial fluctuation within the year and from year to year. In a special issue on crime trends, criminologists Richard Rosenfeld and David Weisburd assert, “[c]rime is not a static phenomenon. Research designs that freeze crime and its correlates at a single moment in time misrepresent the dynamic nature of crime and are bound to produce misleading results.” Thus, it is best to compare various locations and look for trends across multiple years to understand whether a specific crime statistic is “abnormal” or part of the usual variation within crime. Once we establish a pattern within a particular category of crime data, we can test our ideas about what is causing the increase or decrease in crime against the data. With this in mind, we structured our analysis in this paper by comparing homicide statistics across cities and over time.
“Tough-on-crime” appeals are an unfortunate staple of modern American politics. The spike in homicides seen in the overwhelming majority of U.S. cities in 2020, as well as increases in homicides in some cities in 2021, became the subject of misleading political debate and media coverage. Proponents of “tough-on-crime” policies have blamed the surge on several developments: (1) the election of “progressive” prosecutors in a few large cities, (2) the enactment of state laws limiting judges’ imposition of cash bail for certain nonviolent crimes, and/or (3) calls for a reassessment of police department funding.
This fear-mongering rhetoric ignores that in 2020 there was an increase in homicides across the country, including in cities with so-called “tough-on crime” policies and leadership. Our findings show that the homicide spike in 2020 results at least partly from the social and economic destabilization associated with the COVID-19 pandemic, not local criminal justice policies or practices. Current politicized discussions of crime ignore or distort crime data to intensify public fear, heighten racial tension, and undermine criminal justice reforms that promote long-term, sustainable public safety. Our research models the contextual analysis of crime data needed to guide an effective approach to improving public safety.
Assessing the validity of potential diagnoses behind changing crime levels begins with examining national and local crime trends over a multi-year period. In our analysis, we take information about homicides in a sample of 61 cities over seven years to describe the national uptick in homicides in 2020 and the local variation in 2021. That year, some cities reversed course from their 2020 homicide spike (decline), some experienced small homicide increases consistent with the national average (small increase), and others experienced large homicide increases that exceeded the national average (large increase). Here, we establish these patterns to build a foundation for correctly diagnosing potential ailments causing crime patterns. The different trajectories of American cities in 2021 suggest that local context mattered in determining how cities fared after the national homicide spike of 2020. We combine what we know about the local context of our three widely proclaimed ailments (prosecutor reform, bail reform, and police resources) with data about cities’ homicide trends to assess whether any of these purported ailments help explain crime patterns. Our sample is based on 61 of the 100 most populous cities in the American Community Survey 2019. We gathered crime data from each city’s police department and supplemented it with city data reported on the Major Cities Chiefs Association (MCAA) crime reports. We gathered recent homicide data (2020 and 2021) for each city to compare whether and how much recent homicide counts differed from previous years.
Our study reveals that many of these common explanations of recent increases in crime (i.e., prosecutor reform, bail reform, and police resources) are misdiagnoses not supported by the data. However, pandemic-induced instability and income inequality are compelling explanations of recent homicide patterns that are well supported by our analysis. Unfortunately, the destabilizing impact of the COVID-19 pandemic and its exacerbation of inequality has been ignored in many public discussions of crime. Such an omission distorts our understanding of homicide patterns and limits our ability to enact policies and practices that improve public safety.
One of the most robust patterns in crime data is the steady decline in crime, including violent crime, within most U.S. cities over the past 30 years. This pattern has been referred to as the “The Great Crime Decline.” There are several theories about what caused the sharp and continuous decline in crime beginning in the 1990s, but like many social phenomena, crime does not have a singular cause.
The rhetoric that was used to justify mass incarceration and the aggressive policing strategies of the 1990s has resurfaced and is now being used to roll back decades of work that advocates have utilized to shrink mass incarceration and reform discriminatory practices within the criminal justice system. Recent media and political discussions have included calls to return to policies and practices that expanded mass incarceration and disproportionately harm Black Americans, including mandatory minimum prison sentences, three strikes laws, zero-tolerance policing, the militarization of police. Before reflexively returning to the discriminatory and overly punitive practices of the 1990s, we should investigate to what extent their presence or absence is associated with recent changes in crime.
In their nuanced state-level analysis of crime data for the 1990s (1990-1999) and 2000s (2000- 2013), researchers at the Brennan Center for Justice reported that increased incarceration had no effect on violent crimes in either the 1990s or 2000s but was associated with a 0–12% decrease in property crime during the 1990s and no change in the 2000s. Likewise, the analysis revealed that increased policing was associated with a 0–10% decline in crime in the 1990s but had no effect in the 2000s. Comparatively, income growth and decreased alcohol consumption were associated with a 5–10% decline in crime for each variable in both the 1990s and 2000s.
The punitive policies and increased policing that emerged in the 1990s to manage the “crime wave” may have had some effect on crime reduction early on but may not have accounted for decreases in crime since 2000. In contrast, social, economic, and environmental factors, such as the growth in income, reduction in alcohol consumption, decrease in lead poisoning, and an aging population, are too often left out of our anti-crime strategies. Surprisingly, a reduction in alcohol consumption and growth in income were as statistically important as policing in reducing crime in the 1990s, and unlike policing, they have continued to result in reductions in crime since 2000.


Although there has been substantial variation in homicide counts in U.S. cities since 2015, 2020 reveals a pervasive national pattern. In 2020, cities of all sizes across the country experienced increased homicides. Our analysis reveals a spike in homicides in 2020 in all but one (Virginia Beach) of the cities in our sample. This strong national pattern suggests that the factors influencing the increase in homicides in 2020 were experienced similarly across the country and not the result of state and county decision-making, such as policing practices, criminal justice policies, or prosecutorial practices.
We argue that the COVID-19 pandemic created a level of social and economic disruption that contributed to the increase in homicides across the nation. Cities’ ability to respond and adjust to this instability varies and helps explain why some cities seem to quickly “recover” from the 2020 homicide spike and others do not.
The magnitude and consistency of the 2020 spike in homicides can be explained by the emergence of the COVID-19 pandemic and the associated changes in work, school, and social life that accompanied the pandemic. Our analysis reveals that 2021 homicide data shows much more variation between cities and is more likely to be driven by the local context.
When comparing 2021 homicide numbers to the five-year pre-pandemic averages for the respective cities, we again see a sizable variation in localities. In cities that experienced above-average increases in homicide in 2021, that increase made up a 75% increase over their pre-pandemic homicide averages. Cities that experienced homicide growth in 2021 consistent with the national average showed a 39% increase in homicides above their pre-pandemic 5-year averages. Even cities that experienced a decrease in homicides in 2021 averaged a 21% increase from their pre-pandemic 5-year averages, reflecting the magnitude of the 2020 spike.
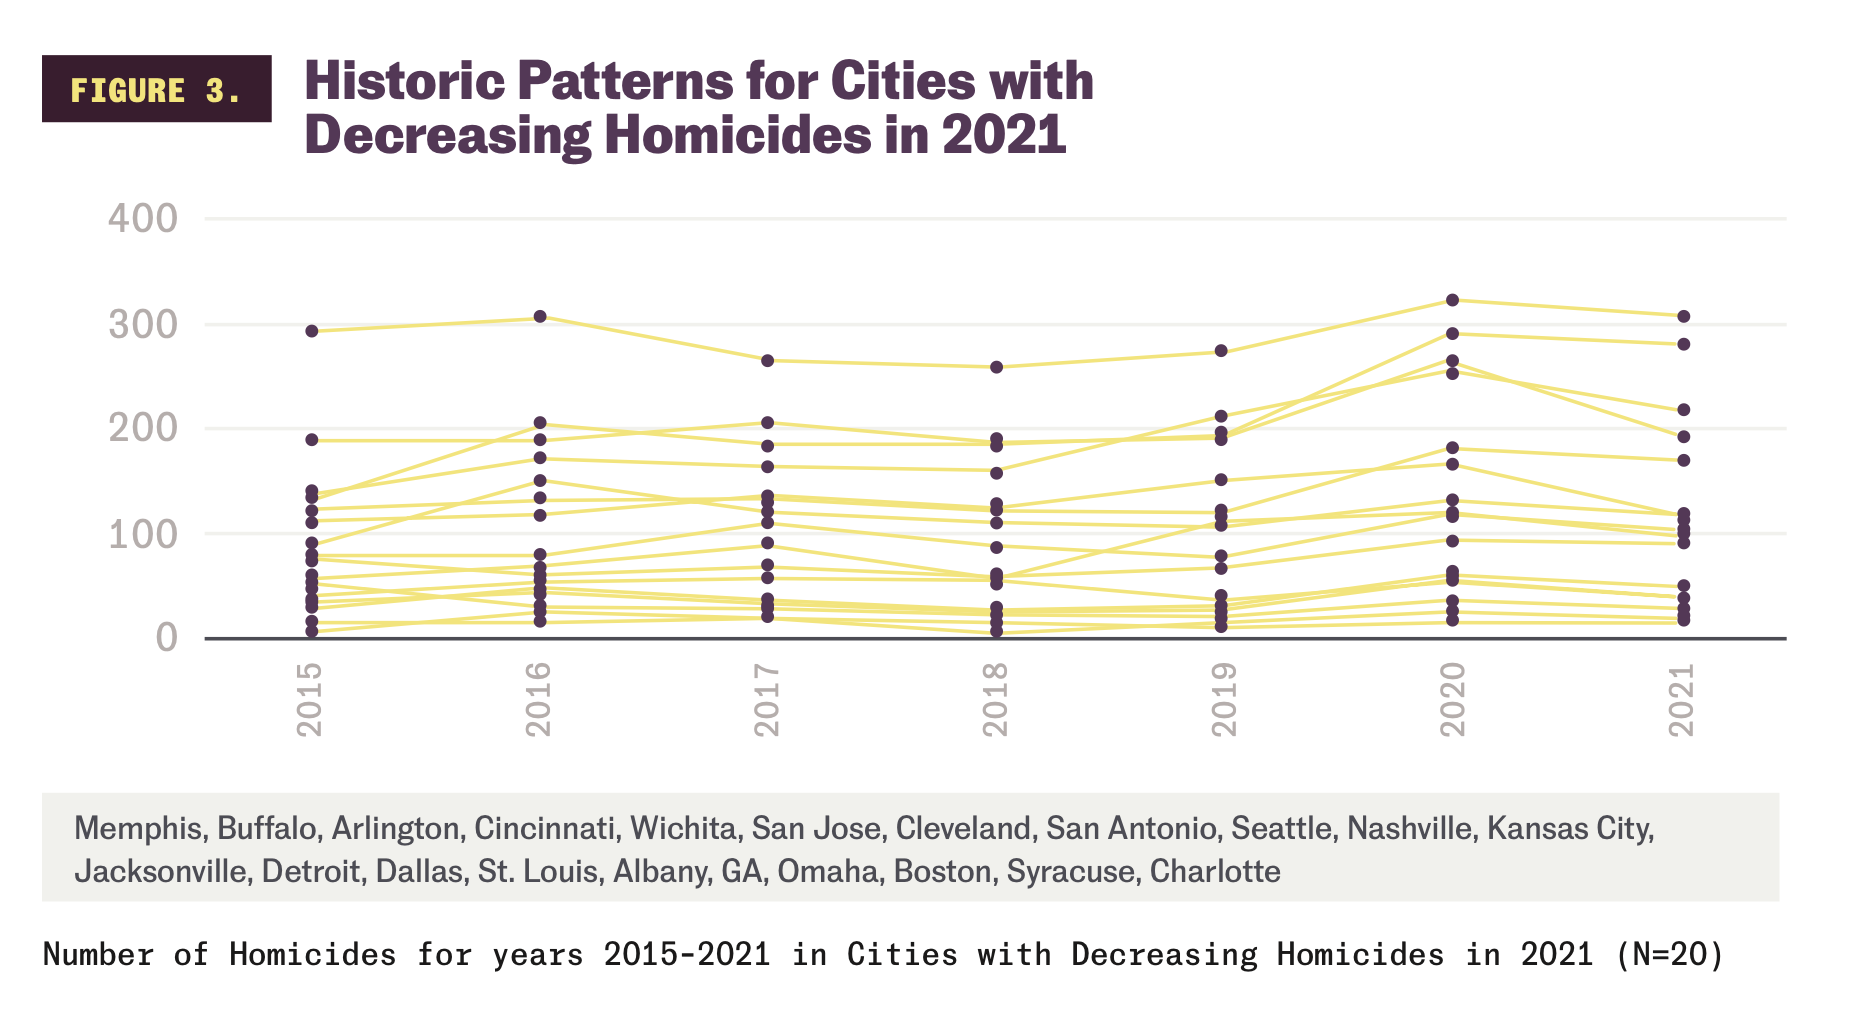
Some cities have “recovered” from the 2020 homicide spike. Of the 61 cities in our sample, over 30% (20) have returned to their typical homicide counts. Figure 3 shows the spike in 2020 followed by a downward trajectory in 2021. Although the magnitude of the increase in 2020 homicides varies by city, in every city shown here, the number of homicides in 2020 is greater than each year in the five years preceding the COVID-19 pandemic. For most of these cities, the homicide spike in 2020 and the number of homicides in 2021 are at or below the number of homicides in the previous spike of 2015- 2016. This suggests that these cities are “recovered” from the 2020 spike, and current homicide counts reflect the typical variation within each city.
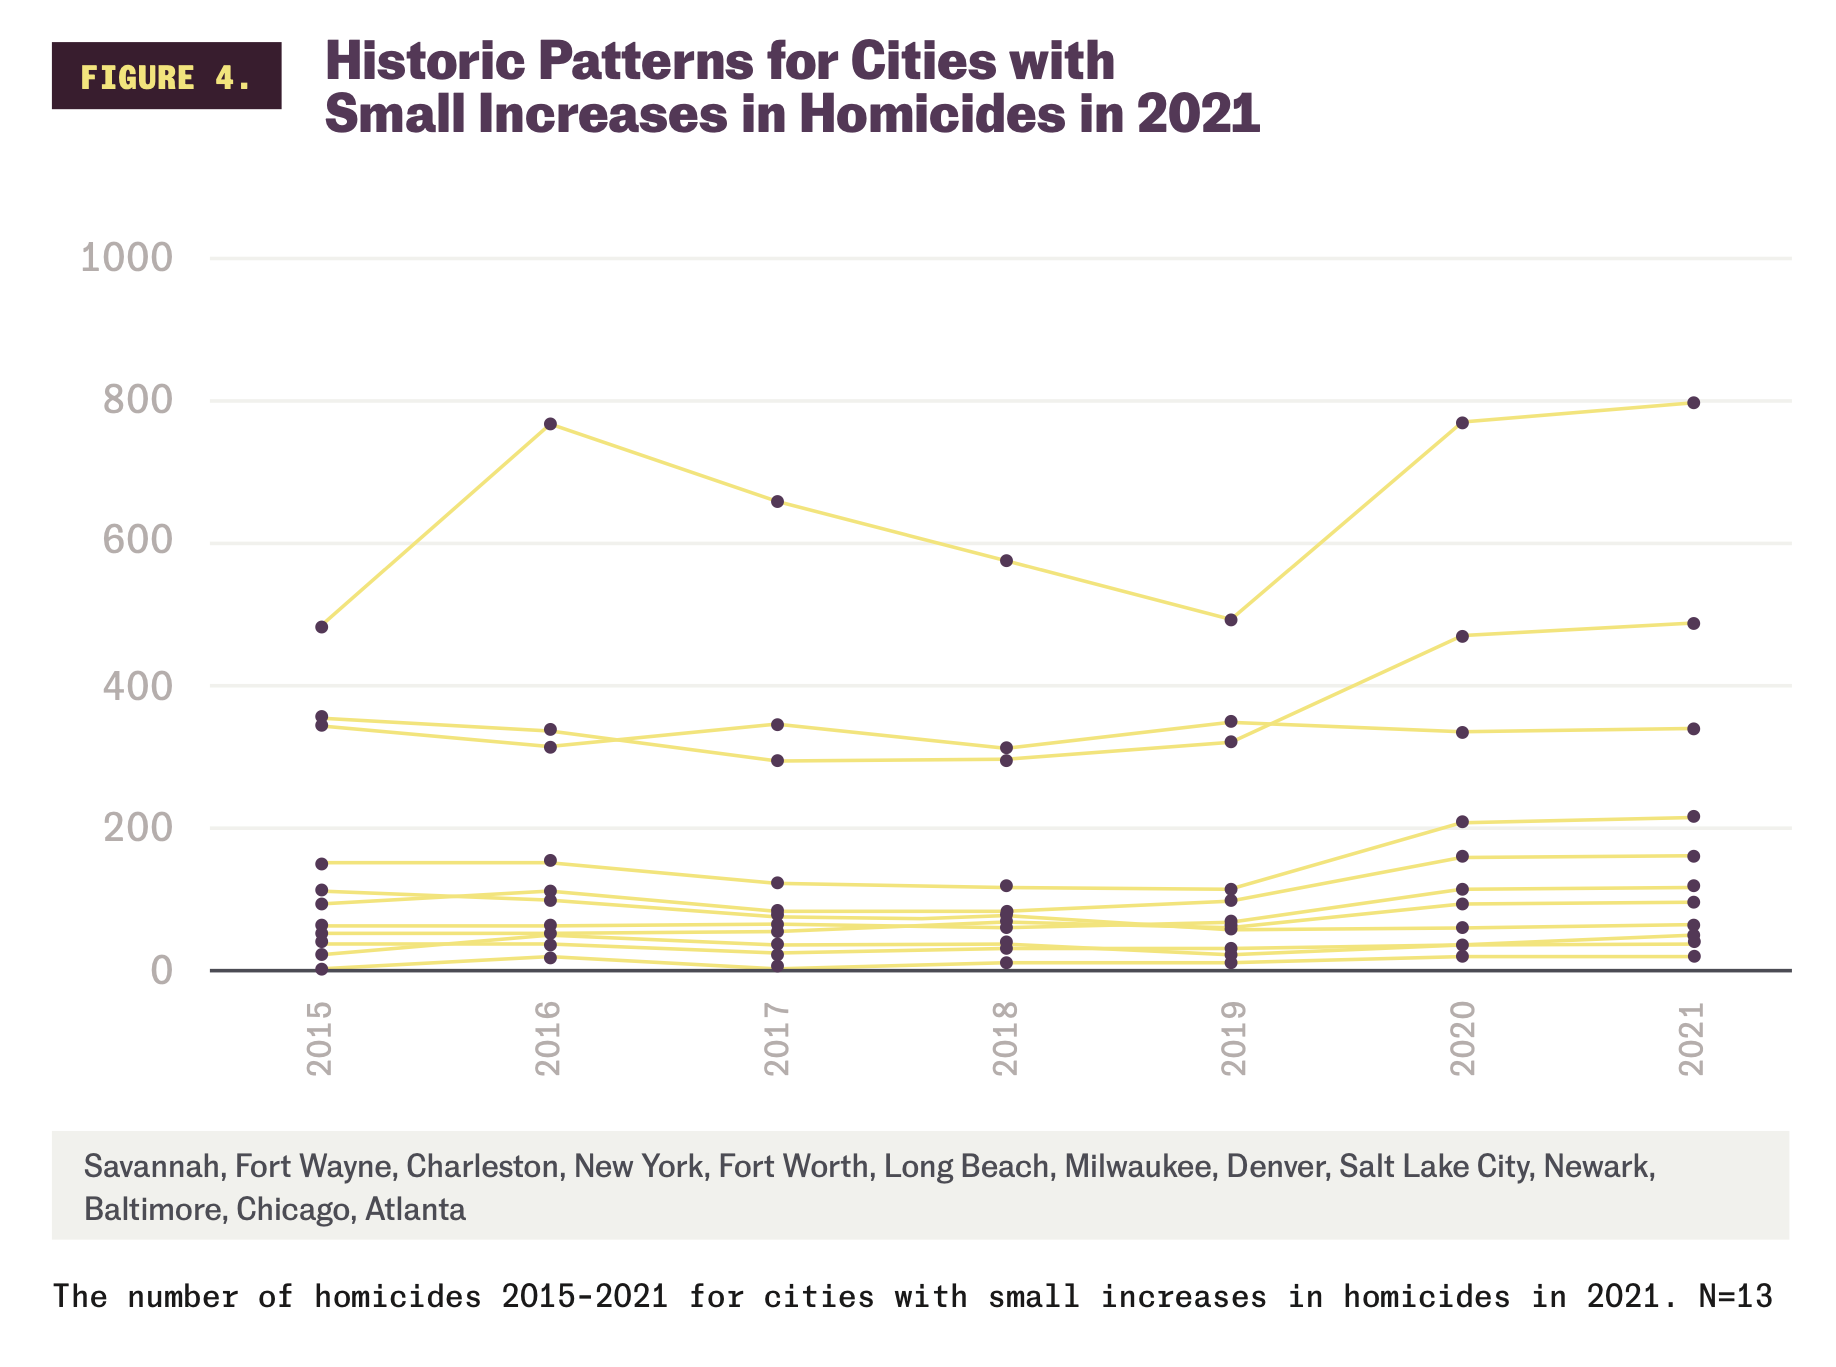
Some cities experience a slight growth in homicides following the 2020 spike. Just over 21% of the cities in our sample (13) have 2021 homicide increases within the national average (6%). While these cities have not returned to their pre-2020 homicide counts, their increased level of homicides reflects the national trend. All these cities show an increase in homicides in 2020, but the magnitude of the increase varies. Each city in this category has less than a 6% increase in homicides in 2021 compared to their five-year average (2015-2019) before the 2020 homicide spike. Yet, the 2020 homicide spike for Chicago is similar to the city’s 2016 homicide spike. For most cities (70%) in our sample, the number of homicides in 2020 is greater than in the preceding five years (2015-2019).
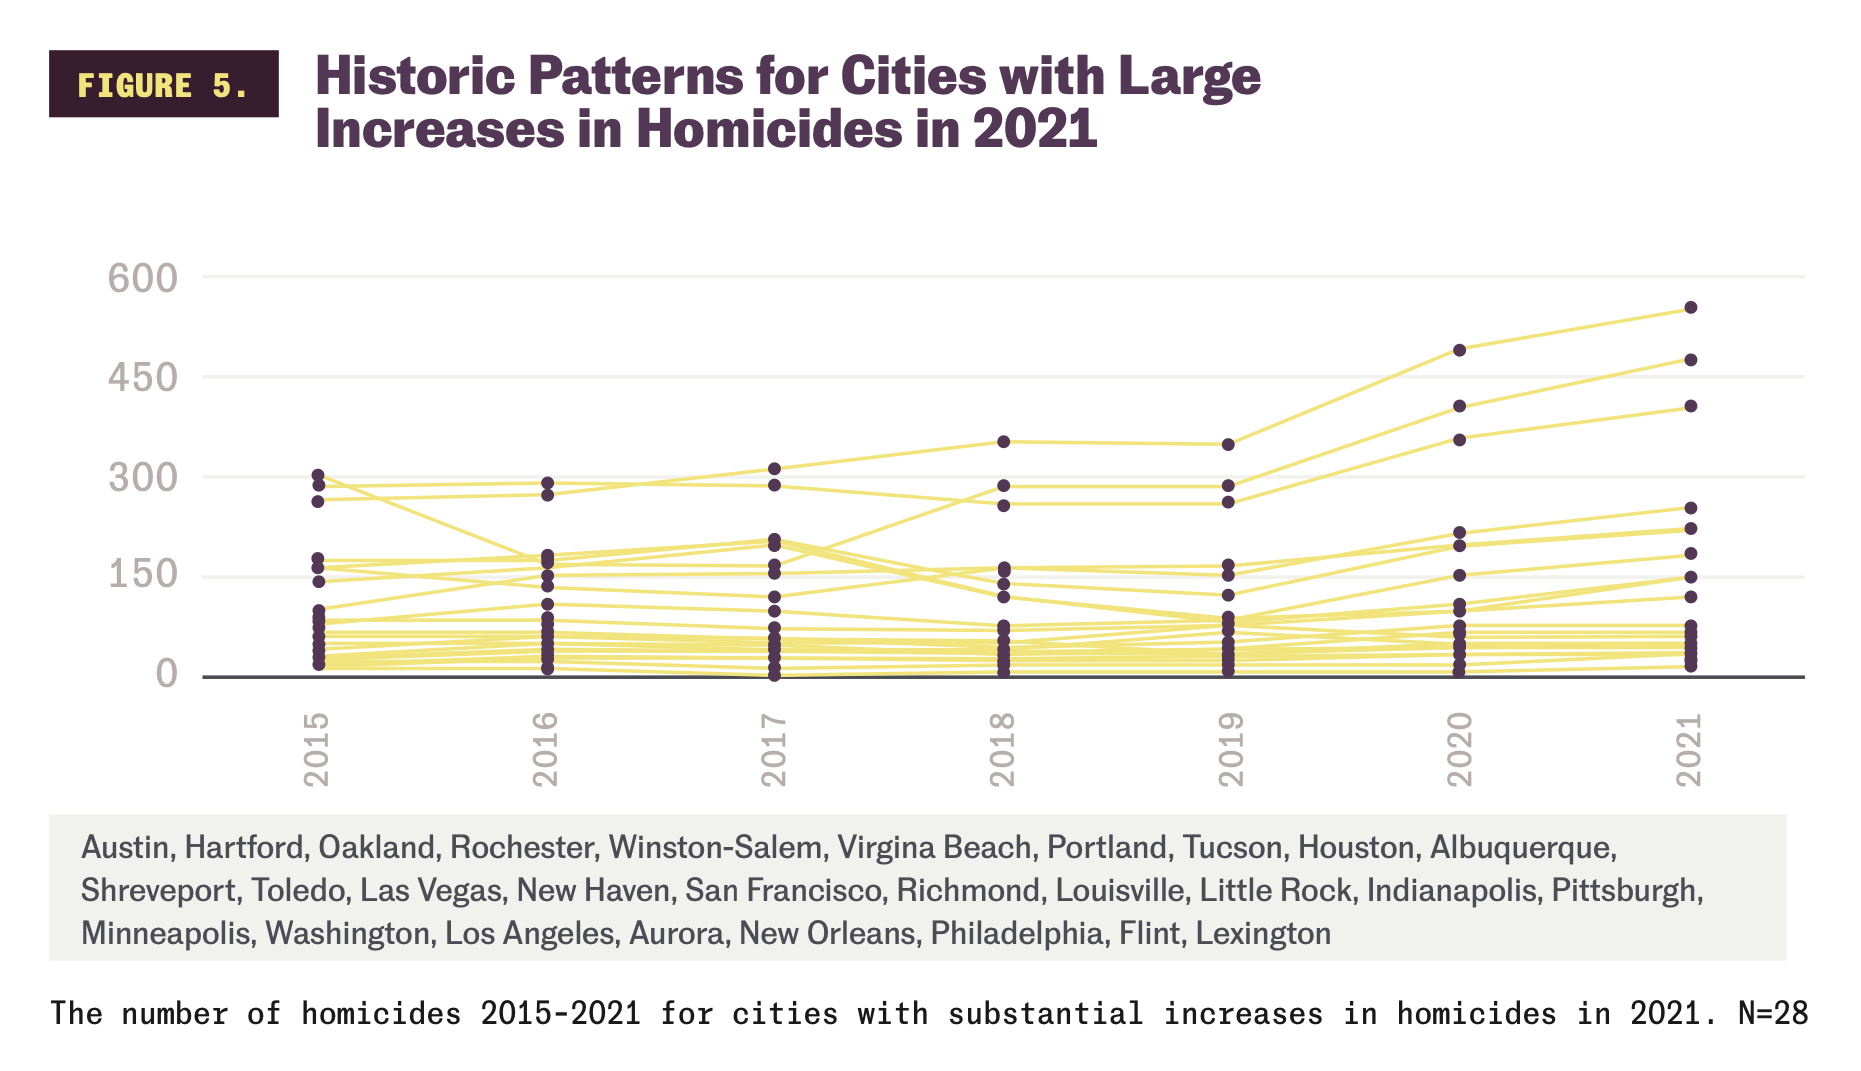
Some cities continue to experience large increases in homicides following the 2020 spike. Slightly less than half (45%) of the cities in our sample show homicide increases in 2021 that exceed the national average. Figure 5 shows the level of increases in homicide counts for cities in this category. Although most of these cities experienced a homicide spike even larger than the earlier spike of 2015, the number of homicides in these cities is still far below the homicide rates of the early 1990s. Most of these cities experienced substantial increases in homicides in 2020 that have continued in 2021. Virginia Beach is the only city in this category that does not show a homicide increase in 2020. Eight of the 28 cities in this graph (Austin, Rochester, Portland, Tucson, New Haven, Louisville, Toledo, and Minneapolis) experienced a 100% or more increase in homicides during 2021 compared to their pre-pandemic five-year average. Seventy-five percent of the cities in this category have homicide counts in 2020 that exceed their five preceding years. For example, the three cities with the largest increases in homicide in 2021 (Los Angeles, Houston, and Philadelphia) had high numbers of homicides in 2020 and 2021, exceeding their earlier homicide spikes in 2015.

It is important to use the national average to compare our homicide data because the homicide spike of 2020 is a national pattern and should not be attributed to city or state-level policies and elected officials. Figure 2 shows that cities with increases in homicides in 2021 above the national average showed a 26% increase in the number of homicides compared to 2020. Cities with a small 2021 growth in homicides, consistent with the national average and variations in previous years preceding the pandemic, experienced an average 2% increase in homicides over 2020. Cities with decreases in homicides during 2021 averaged a 13% decrease in the number of homicides compared to 2020.
The ubiquity of the crime spike in 2020 suggests that non-local factors are at the root of the national homicide uptick. What shaped cities’ trajectories after the 2020 homicide spike is more variable, and we can look to more proximate factors to explain the differences. Our report evaluates these factors – possible diagnoses for the crime spike – keeping in mind the three post-2020 trajectories that show how cities managed the 2020 uptick. We analyze six dimensions of local context: presence/absence of cash bail reform, presence/absence of progressive prosecutors, level of police funding, COVID-19 death rate, housing instability, and income inequality.ii We investigate whether these factors distinguish cities that quickly recover from the 2020 homicide spike from those that do not.
Politicians and media articles often attribute real or perceived increases in crime on so called “soft-on-crime” policies, like cash bail reform or progressive reform in prosecutors offices. Opponents point the finger at these practices to claim they enable upticks in all crime.
To assess the merit of claims that progressive prosecution and bail reform weaken a city’s ability to weather national crime trends, we examine how a city’s policies and practices compare to their homicide trajectory from 2015 to 2021. In our sample, 19 cities (31%) have implemented some form of bail reform, and 18 cities (30%) have progressive prosecutors. Our analysis shows that cities with no bail reform and traditionalist prosecutors – the “tough-on-crime” opponents of reformist practices – fared no better than their counterparts. Whether a city implements bail reform or elects a progressive prosecutor tells us very little about that locality’s 2021 homicide trends.

Our analysis shows that a city’s cash bail policy is not associated with whether New York or any other city in our sample experienced a 2020 homicide spike or how quickly it recovered in 2021. As Figure 6 shows, cities with bail reform experienced a 47% increase in homicides compared to their 5-year homicide average (2015-2019) before the 2020 spike. Cities without bail reform experienced a 51% increase over the five-year average before the 2020 spike (2015- 2019). Thus, localities with bail reform experienced a slightly lower increase in homicide compared to pre-pandemic five-year averages.
The enactment of bail reform itself is not a useful explanation for understanding which cities experienced an increase in homicides in 2021 and which did not. This is consistent with studies that compare crime rates before and after implementing bail reform within a locality and show either no impact on crime rates or an increase in public safety after implementing bail reform.
The Thurgood Marshall Institute Report “Pretrial Justice Without Money Bail or Risk Assessments, Principles for Racially Just Bail Reform” details the issues with current U.S. money bail system through a racial justice lens and provides principles for comprehensive bail reform that both lowers the number of individuals in jail and diminishes the racial disparities in pretrial incarceration.
Cities with traditional prosecutors still experienced the 2020 homicide spike. The election of a progressive prosecutor is not automatically followed by an increase in homicides. By “progressive prosecutors,” we mean prosecutors who campaigned for and then implemented policies in their offices following principles such as addressing mass incarceration, refusing to prosecute certain types of crimes (e.g., sex work or marijuana possession) as a form of harm reduction, enhancing “conviction integrity” units, and/or refusing to prosecute cases associated with law enforcement officers that have a history of dishonesty or corruption.
Both traditional prosecutors and progressive prosecutors are included in cities with large increases, small increases, and decreases in homicides in 2021. Cities with a prosecutor described as “progressive” experienced a 9% growth in homicides in 2021 compared to a 7% increase in those with more traditional prosecutors. These 2021 homicide rates reflect a 50% increase over the pre-pandemic 5-year average, compared to a 49% increase for traditional prosecutors. Each city typology (those experiencing small increases in homicide, large increases in homicide, and decreases in homicide in 2021) includes progressive and traditional prosecutors. The one- to two- percentage-point difference in homicides in cities with progressive or traditional prosecutors is not a meaningful difference.
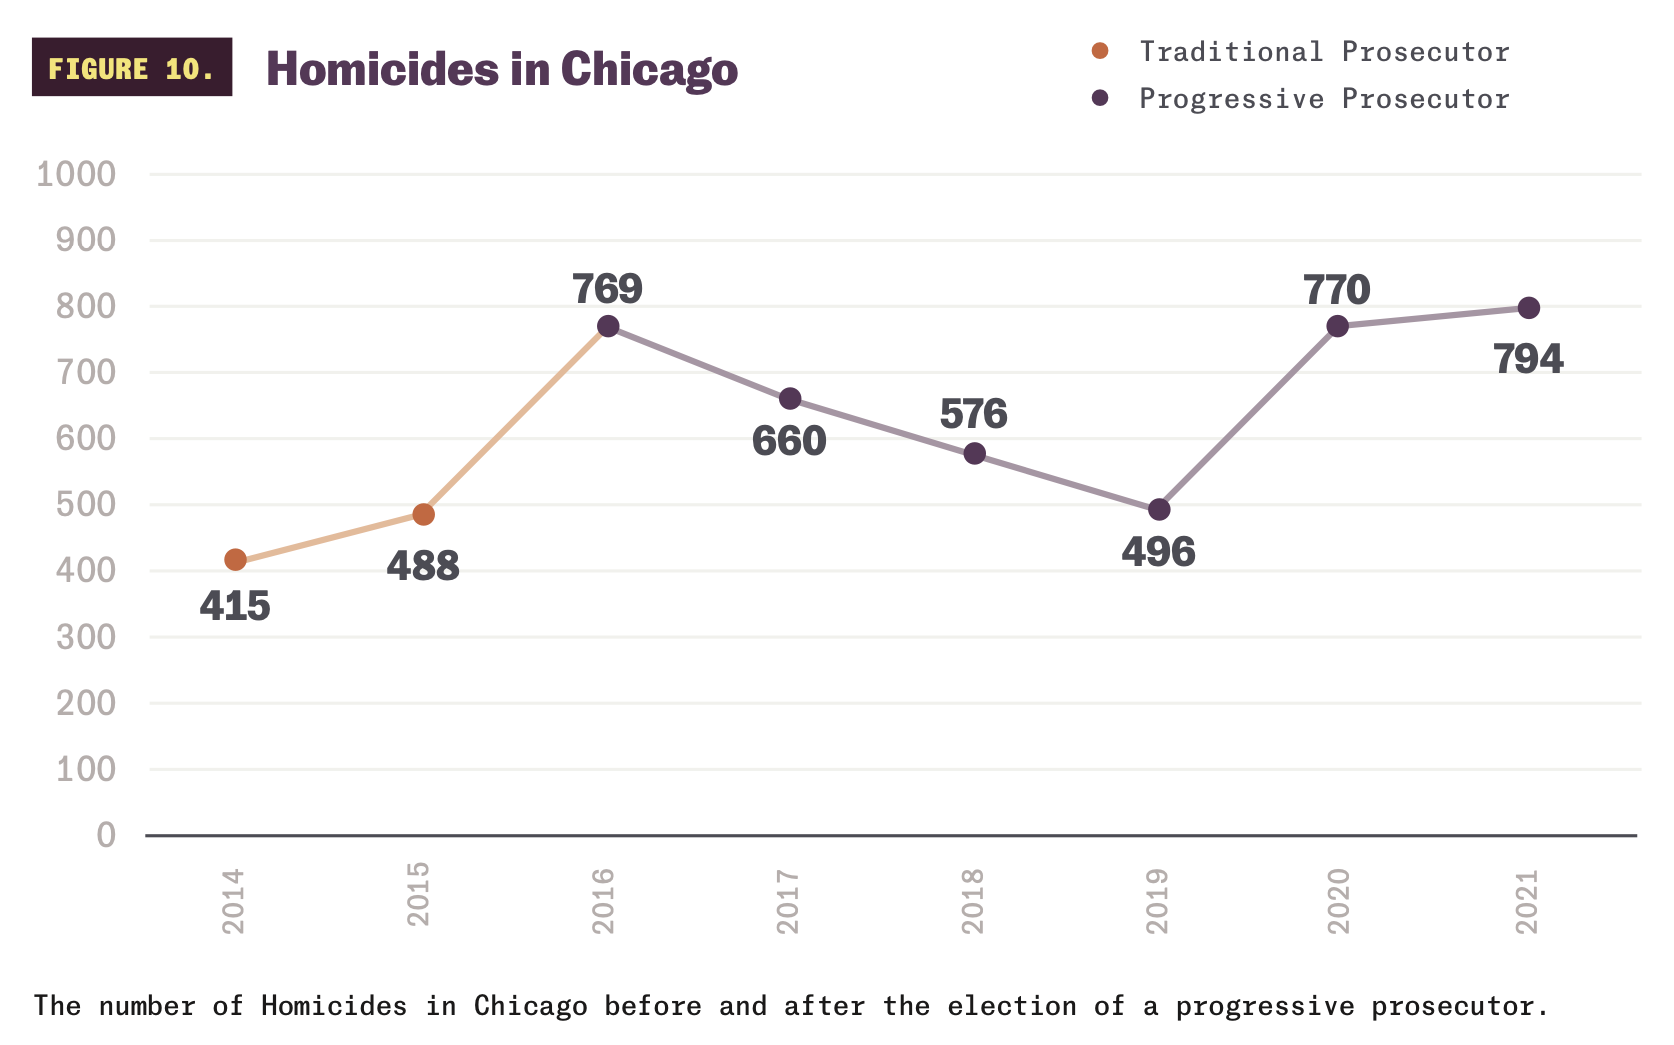
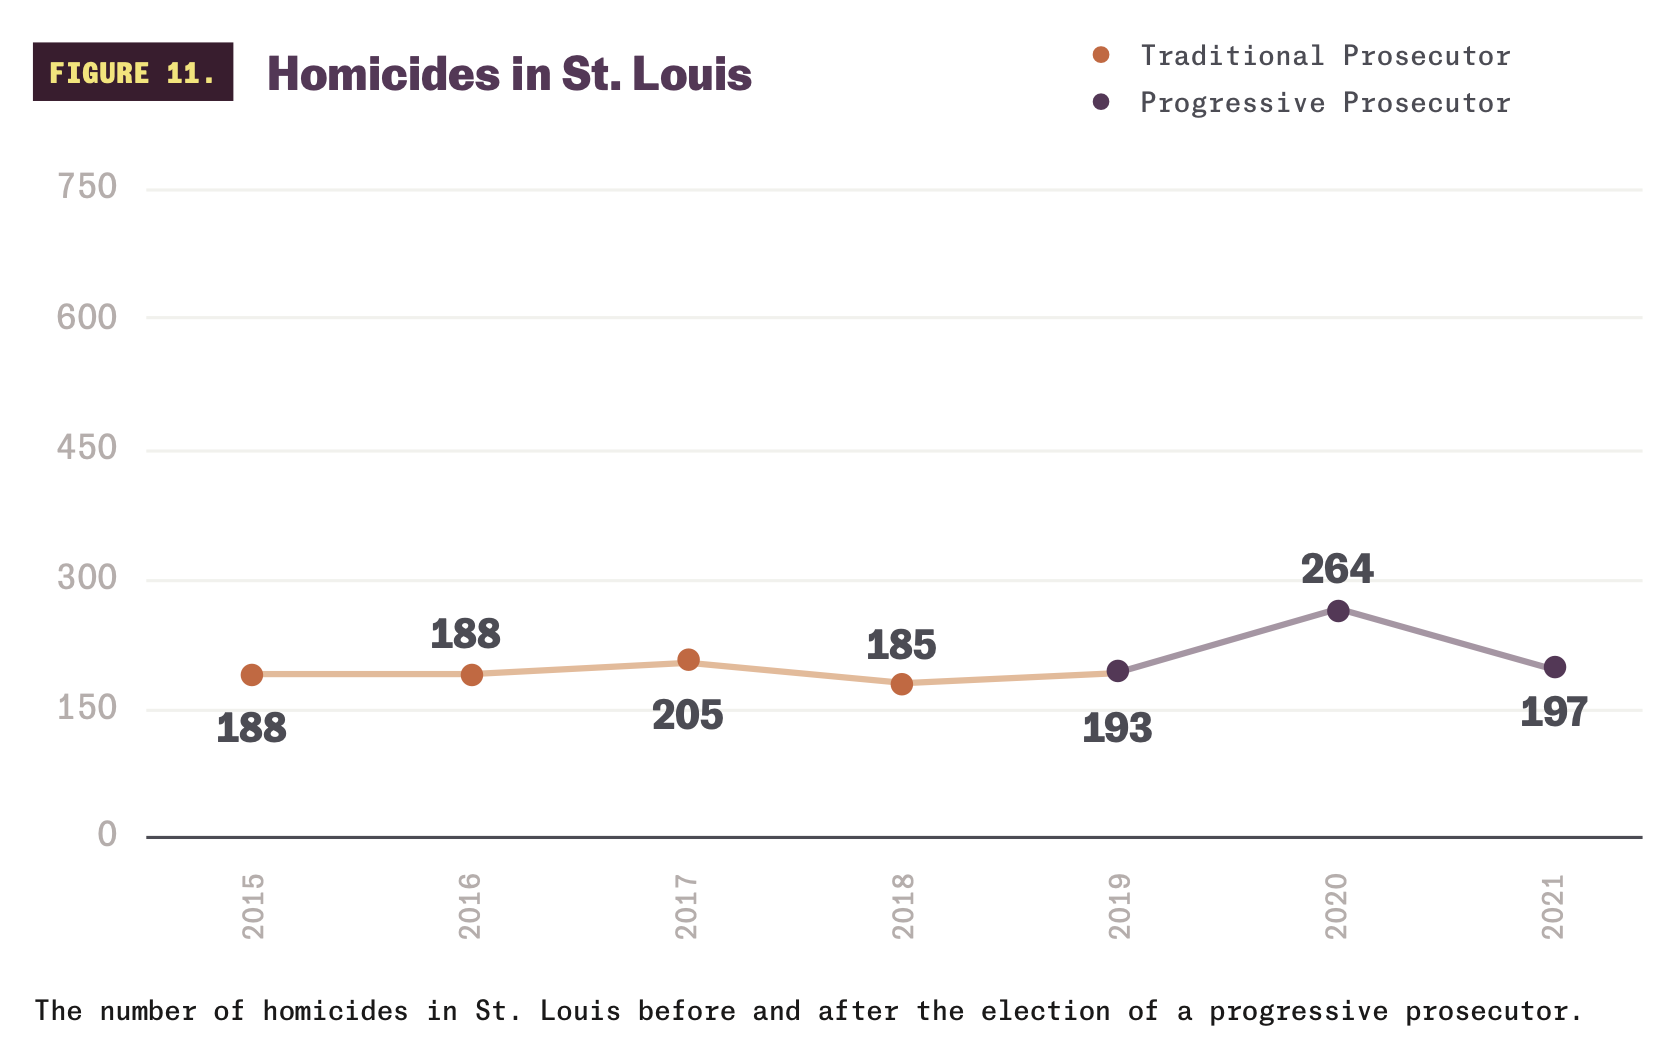
The false narrative that progressive prosecutors are the reason for homicide spikes in American cities lacks supporting evidence. As demonstrated, cities with progressive prosecutors have seen a range of homicide counts. In all three examples, Chicago, Philadelphia, and St. Louis, the rise in homicides in 2020 seems to be part of the national pattern of the 2020 homicide spike rather than the influence of individual prosecutors. Indeed, other research suggests that progressive prosecutors have had no detectable effect on rates of major crimes, including homicide.
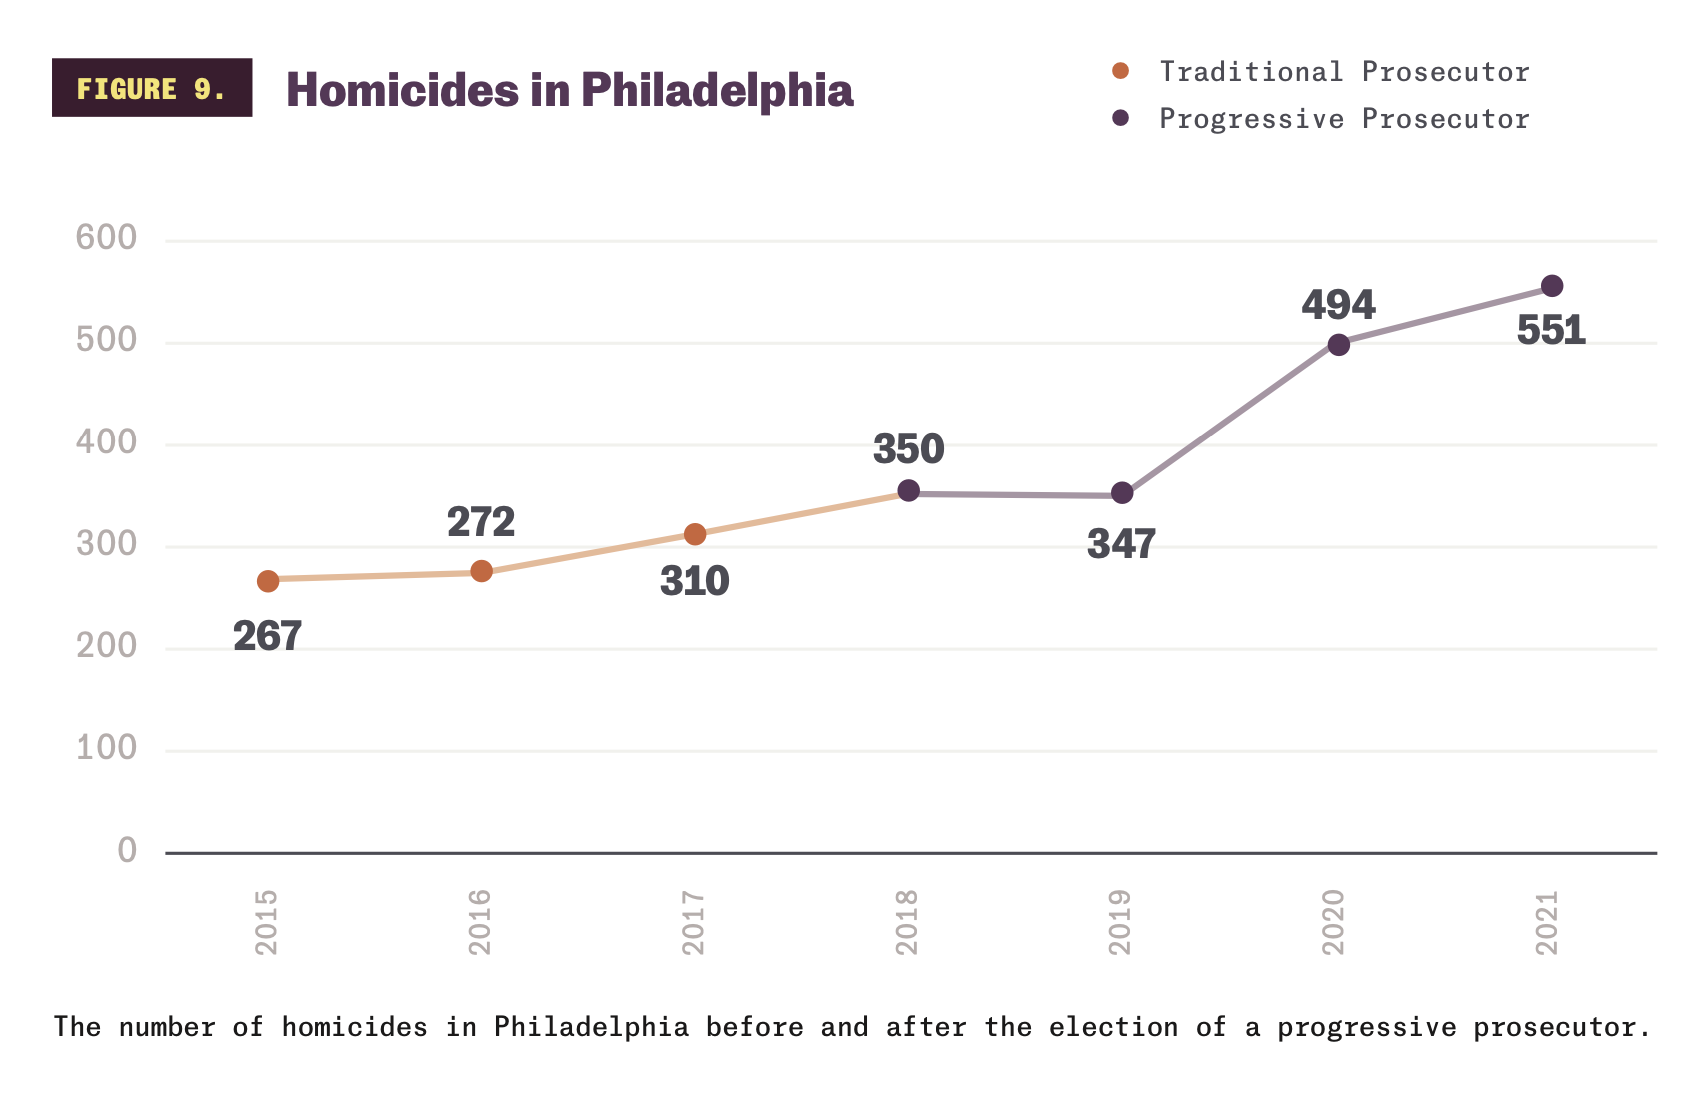
Figures 9, 10, and 11 break down the exact moments when progressive prosecutors assume their offices while showing homicides over time. Larry Krasner’s tenure as Philadelphia’s District Attorney started in 2018 and showed a stable number of homicides before the 2020 homicide spike (Figure 9). Kim Foxx’s tenure as Cook County State’s Attorney started in 2016 and accompanied a decrease in homicides until the 2020 spike in homicides (Figure 10). Finally, Figure 11 shows how St. Louis County Prosecuting Attorney Wesley Bell’s tenure coincided with the homicide spike. Since cities across the nation experienced a spike in homicides in 2020 and St. Louis was one of the few cities that had the 2020 homicide spike followed by a decrease in homicides in 2021, it is unlikely that the 2020 increase in homicides is a result of Bell’s actions in office.
Thirty percent (18) of the cities in our sample had progressive prosecutors, and they were present in each of the 2021 categories. Thirty-three percent of the cities in our sample with progressive prosecutors were in the declining homicide category, 22% showed small increases, and 44% showed large increases. This distribution is similar to that of the traditional prosecutors in our sample. Thirty-four percent of the traditional prosecutors were in the declining homicide category, 18% showed small increases, and 48% showed large increases. Because all three categories have a similar distribution of progressive prosecutors and traditional prosecutors, it is incorrect to claim that the mere presence of progressive prosecutors results in increased homicides.
We chose a city with progressive prosecutors from each of the three categories reflected in our analysis (cities with sharp and continuing increases in crime, cities with small increases following the 2020 homicide spike, and cities experiencing the 2020 homicide spike followed by decreases in 2021) to illustrate the diversity of outcomes associated with progressive prosecutors. Chicago represents a city with small increases in 2021 homicides following the 2020 spike. Philadelphia is a city that has experienced a homicide spike in 2020, followed by a large increase in 2021. St. Louis is a city that experienced a 2020 homicide spike followed by a decrease in homicides in 2021. Figures 8-11 provide a more in-depth examination of homicide trends in cities with progressive prosecutors.
The fact that cities with “law-and-order” prosecutors were not immune to the national 2020 homicide spike again suggests that the spike is a part of a nationwide phenomenon and not local criminal justice practices. Seventy percent of our sample is composed of cities with traditional prosecutors, and they are similarly distributed to progressive prosecutors across each category. Figure 12 documents the patterns of homicides in cities with prosecutors known to be “tough on crime.”
Rochester, Winston-Salem, and Pittsburgh illustrate the range of outcomes associated with “law-and-order” prosecutors. Each category (small, large, decline) has prosecutors who employed a “law-and-order” narrative in their campaigns for the prosecutor’s office. All these prosecutors have been in office for ten or more years. The data reveals that cities with these “law-and-order” prosecutors also experienced a significant homicide spike in 2020. This reinforces the point that the 2020 homicide spike corresponds to national changes rather than local criminal justice policies and practices.
We have shown that neither the progressive policies of a city’s chief prosecutor nor its implementation of bail reform explains how the city fared against a national uptick in homicides in 2020. “Soft-on- crime” policies and practices are not credible diagnoses for recent increases in homicide.

The national response to George Floyd’s murder in 2020 renewed the debate over allocation of resources to policing and law enforcement in America. Calls to reallocate resources from police departments to community-based services aimed at improving public safety were met with strong pushback from critics who claimed that reducing police resources would undermine public safety. When some cities took steps to reallocate funds from policing to other municipal services and programs, politicians and media sources quickly claimed that the national spike in violent crime in such cities was related to efforts to “defund” police departments.
We know from our evaluation of crime trends that the homicide spike was felt across the nation. Still, public figures repeatedly manipulated data points to concoct a false narrative that connected reduced police funding to increased crime. Here we dig deeper into a possible relationship between police funding and staffing and homicide levels over time, concluding that the two are not associated. The resources that police have at their disposal in a given city do not tell us much about how that city will fare when crime rises across the board, making police resources another misidentified ailment in our search for factors underlying crime trends.
Based on a Bloomberg CityLab analysis, less than half of the largest 50 U.S. cities reduced their police funding in 2021. As a group, the difference between police spending as a share of the general funds in 2021 fell less than 1% from 2020. Moreover, New York and many other cities that markedly reduced police budgets in 2020 reversed course and raised funding in 2021 despite a lack of evidence that changes in funding were at play in New York City’s experience of the national crime wave 2020. Moreover, homicides continued to rise in many cities with large increases in police budgets. Zeroing in on law enforcement funding and manipulating it in response to an outcry over crime waves is akin to a doctor prescribing you the wrong medicine. The medicine not only fails to solve your problems but creates a whole new set of symptoms. The outsized focus on police funding also distracts from conversations about evidence-based crime- prevention strategies and how policing itself can be detrimental to public safety.
A review of law enforcement funding over time demonstrates that increased police funding does not result in decreased crime. The spike in homicides in 2020 affected cities with large and well-resourced police forces and without bail reform or progressive prosecutors. Figure 13 shows the homicide increase in these cities despite rapid increases in police funding. According to the National Police Funding Database, Little Rock, Arkansas had more than twice as many police per 1,000 residents as other similarly sized cities; Richmond, Virginia, had almost three times as many. Despite this overrepresentation of police, Richmond’s 2021 homicide number increased by 60% over the five-year pre-pandemic average, and Little Rock’s homicide increase was 73% above the five-year pre-pandemic average. The ten cities shown in Figure 13 have traditional prosecutors, no bail reform, and spend an average of $2.1 million annually on policing. Still, their average number of homicides increased from 82 in 2019 to 111 in 2020, a 35% increase, and further to 134 in 2021, a 21% increase.

Cities with well-funded and well-resourced police departments were susceptible to the pandemic homicide spike, which suggests that increasing cities’ allocation of resources to police is not a solution to an increase in homicides. Discussions about solutions to crime must also consider the broader context of public safety. Despite pro- policing messaging that presents police as an asset to public safety, our current system of law enforcement poses a significant threat to the safety of communities, particularly Black, Brown, and low- income communities.
This database tracks the federal funds, grants, and military equipment distributed to local law enforcement agencies. It also provides information about police misconduct complaints filed by individuals, consent decrees, and settlement amounts.
We have a responsibility to ensure that crime prevention does not exact unnecessary and discriminatory costs on segments of our population and to choose solutions that maximize prevention while minimizing harm. When we apply these considerations to policing, it falls short. Recent research by economists suggested that adding a single police officer can prevent between 0.06 and 0.1 homicides. Yet, that same study admits that “[i]n cities with relatively large Black populations, the returns to investments in police manpower are smaller and perhaps non-existent for Black civilians.” Several other studies have demonstrated the mental, emotional, and physical harm policing entails.
The national increase in homicides in 2020 coincided with another significant collective experience: the COVID-19 pandemic. This pandemic dramatically uprooted the lives of Americans all over the country and threw millions of households into disarray. More research is needed to understand how exactly the pandemic has driven crime. However, there are several aspects of the pandemic that we have reason to believe might impact crime rates, and we have the data to assess whether those hypotheses are credible. Before the pandemic, research showed that other kinds of social and economic destabilization have been associated with increased crime.34 Since the pandemic caused those types of destabilizations, it is fair to assume that the pandemic contributed to the homicide surge. Here, we assess the relationship between city-level measures of destabilization and a city’s success or failure in responding to the homicide spike of 2020, concluding that economic insecurity and income inequality are credible diagnoses for changes in crime rates.
The COVID-19 pandemic caused significant disruptions to the economic and social processes that are known to influence crime. First, the pandemic destabilization weakened the level of youth supervision. Research shows that participation in crime increases throughout adolescence and peaks at age 17. Many parents were required to work while youth were expected to participate in remote learning. Attendance during remote learning was a major issue, and many young people were released from their usual level of adult supervision.
Because of the theoretical importance of youth supervision and employment in crime prevention, many cities institute youth summer jobs programs as a part of their anti-crime strategy. In an analysis of one such program in Chicago, high school students’ participation in the One Summer Chicago Plus program was associated with a 45% reduction in violent crime arrests. Unfortunately, the COVID-19 pandemic created logistical and funding challenges in maintaining youth summer employment programs regardless of their effectiveness. With budget constraints during the pandemic, many localities decided to suspend their youth summer employment programs to fund other budgetary concerns. Thus, the COVID-19 pandemic gutted the household and community- based supports and supervision that are known to decrease youth participation in violent crime.

Figure 14 shows the strong association between pandemic-induced destabilization and homicide rates. The cities with the greatest amount of death from COVID-19 were also the cities experiencing escalating homicides in 2020 and 2021. Using CDC data from March 2020 through December 2021, cities with the highest year-to-date death rate from COVID-19 experienced the largest increases in homicide during the pandemic. Particularly for the Black and Latinx communities that were disproportionately impacted by COVID-19, the highest death rates were not just among the elderly but included large numbers of working-age populations. This could be attributed to the large numbers of Black and Latinx workers in service jobs deemed “essential” who were forced to work during the height of the pandemic. The death of these individuals is not only an emotional loss but often leaves families more financially and socially unstable and potentially less able to continue previous levels of youth supervision.
The COVID-19 pandemic also contributed to an increase in homicides by generating more economic and food insecurity. Massive layoffs associated with the response to the pandemic intensified income insecurity, particularly for people who were already the most economically vulnerable. In August 2020, approximately 10% of Americans reported that their household did not have enough food to eat within the past seven days of being surveyed, 14% reported that they were behind on rent, and around 32% reported that they did not have enough money to cover their usual expenses. Without enhanced support and public policy protections enacted by the federal, state, and local governments to respond to the pandemic and its economic fallout, the hardship in 2020 and 2021 would have been far worse. Research suggests that poverty and income inequality are associated with increases in crime, particularly violent crime. The COVID-19 pandemic increased both poverty and income inequality, creating the conditions associated with an increase in homicides.
of households did not have enough food to eat within the past seven days
of households were behind on rent
of households did not have enough money to cover their usual expenses
Source: Center on Budget and Policy Priorities
Income inequality is a robust predictor of crime above and beyond the influence of poverty.Societies with smaller income differences between rich and poor tend to have better health and less violence. Using a national data sample from the Uniform Crime Report, researchers compared the state-level homicide rates and state- level government spending on social and public health services, including investments in housing, education, and income support. They found that decreasing inequality by increasing government spending by $10,000/poor person is associated with a 16% decrease in the homicide rate.
Figure 15 also shows a consistent and direct relationship between current homicide patterns and the degree of income inequality in specific localities. The graph shows that cities with the highest increase in homicides during the pandemic also had the highest income inequality in 2019, cities with the lowest inequality had the lowest increases in homicides, and cities with moderate income inequality had moderate increases in homicides. Two standard measures of income inequality are the Gini coefficient and the interquartile ratio (IQR). IQR organizes a community from smallest to largest income, divides it into four equal parts, and presents the differences between the third and first quartile in relation to the median income. An IQR of 1 indicates more income inequality, and the further above 1 indicates increasing levels of income inequality. Cities in the category of above-average increases in homicides 2020-21 have IQR scores of 1.47 times the median income. Likewise, cities with the lowest homicide spike have the lowest levels of income inequality: 1.16 times the median income.


Housing instability is another form of economic and social instability aggravated by the COVID-19 pandemic. In a study investigating the impact of eviction on crime rates in Philadelphia, researchers found that, while controlling for poverty, neighborhoods with higher eviction rates also had higher rates of homicide, robbery, and burglary. This helps us to understand the close association between evictions and homicides in the pre-pandemic years.
Figure 16 shows a strong, direct relationship between evictions and recent homicide patterns. Cities that most quickly bounced back from the 2020 homicide spike are cities that had the lowest eviction rates in 2019. Similarly, cities that have the largest increases in homicides after the 2020 spike are those that also had the highest eviction rates in 2019. Although there were various federal, state, and local moratoria on evictions during the beginning of the pandemic, many households were still evicted, and this number continues to increase. By synthesizing data from Princeton’s Eviction Lab and our own data on homicides, we see that cities with the highest increases in homicide during the pandemic also have the highest average eviction rate preceding the pandemic. Likewise, cities with the lowest increases in homicides during the pandemic have the lowest average eviction rate before the pandemic.
The root causes of crime are complex and varied, but diagnosing the correct ailment allows for evidence-based solutions that disrupt the conditions leading to crime. Having identified pandemic- induced destabilization, economic inequality, and housing instability as a few of the correct ailments contributing to crime patterns, how do we use this knowledge to stem the tide of crime instead of simply reacting to it? The first step is rethinking how we engage with crime statistics (see How to Talk Back to a Crime Statistic). We must also encourage elected officials and other stakeholders to invest in solutions that address the conditions leading to crime. These interventions can take many forms. Some categories of evidence-based interventions to reduce violent crime are:
Community programs aimed at intervening to reduce or prevent violence are alternatives to policing that support individuals at high risk of perpetrating or experiencing gun violence. Neighborhoods in cities like Baltimore, Chicago, New York City, and Philadelphia saw shootings decrease more than 30% after implementing a program modeled after Cure Violence, which seeks to change norms about violence and provide pathways out of violent behavior for individuals involved in gun violence. President Biden’s American Rescue Plan includes funding that can be put toward these programs, which already exist in several major cities.
A body of evidence suggests that environmental factors can influence crime in communities. Investments that improve environmental factors such as creating useable community gardens and other usable public spaces on vacant lots can reduce the incidence of crime.53 One trial found that such improvements to vacant lots in neighborhoods with median incomes below the poverty line reduced gun assaults by more than 17% compared to areas around lots that weren’t treated.Stable housing itself can be important for reducing crime. One study matched police records with calls to Chicago’s Homelessness Prevention Call Center and found that eligible callers for whom emergency assistance funds were available saw a 51% reduction in violent crime arrests versus eligible callers for whom no funds were available.
Economic stability is critical to reducing involvement with the criminal legal system. Interventions aimed at promoting economic stability can also more sustainably promote community safety and wellness than policing does.iii Benefits and programs that promote stability and financial well-being buffer against crime and address existing resource and opportunity disparities. Youth employment programs, for example, provide a productive, structured environment for youth and adolescents and effectively reduce the incidence of crime among participants. The largest such program in the United States is the New York City Summer Youth Employment Program, which served more than 160,000 youth between 2005 and 2008. Those participants were 17% less likely to be arrested during the summer program and 23% less likely to be arrested for a felony during the program. Those effects were particularly strong for at-risk youth who had contact with the criminal-legal system prior to the program.
Other public policy solutions that promote economic stability are also associated with a decrease in violent crime. A 2021 study found that earned income tax credits (EITC), which increase employment and reduce poverty among people with low socioeconomic status, are associated with significant reductions in violent crime. Compared to a baseline of no EITC, enacting a state credit equal to at least 10% of the federal rate is associated with a 10% decrease in violent crime. Whatever solutions used must be evidence-based and responsive to the local context. Reducing inequality and instability by targeting the root causes of crime in a given locality is the first step toward promoting public safety. Interventions aimed at reducing inequality, instability, and other conditions associated with crime make us all safer and make our communities healthier and more prosperous. As more credible diagnoses are identified, we should deploy more evidence-based interventions to prevent them from making our communities unsafe.
Crime statistics can be helpful in understanding and addressing the structural factors that affect crime trends. Unfortunately, bad-faith actors often manipulate these statistics to sensationalize, inflate, confuse, or oversimplify public safety discussions. By misidentifying the catalysts behind crime patterns, we lose our ability to diagnose the proper ailment and administer the correct medicine. Identifying and focusing on the root causes of recent homicide trends – namely, how the COVID-19 pandemic has exacerbated instabilities like housing insecurity, economic precarity, and inequality – is vital for protecting public safety. It is equally important to expose the wrong diagnoses that compromise public safety by distorting reality and distracting our attention from meaningful solutions.
Improving our literacy in assessing claims about crime trends and our evaluation of crime statistics can help ensure that we are not susceptible to misrepresentations of crime statistics used to push punitive policies and practices. As we’ve shown here, these punitive approaches bear little correlation to how cities have weathered national changes in violent crime rates over time. Instead, more attention to economic instability, eviction, and other social and economic factors associated with crime is a more promising intervention avenue that can truly promote public safety.
The authors are grateful to Anne Houghtaling, Jin Hee Lee, Puneet Cheema, Krissy Roth, John Guzman, Elias Isquith, and Janai Nelson for their leadership and valuable insights throughout the development of this research report. Special thanks to Paul M. Barrett for his thoughtful review and comments on this report.